Effortless Data Query & Dashboard Creation with Visper AI
Published: 6/16/2025
Welcome to Visper — The AI-Powered Way to Query Data and Build Dashboards with Natural Language
Visper is the easiest way to query your data and build beautiful, interactive dashboards using AI and natural language — no coding required. Whether you’re a data analyst or a business user, Visper acts like your personal AI data analyst, empowering you to explore datasets, visualize insights, and collaborate in real time through a conversational interface.
You can also watch the tutorial video here to see Visper in action.
In this quick tutorial, you’ll learn how to:
- Connect your data source
- Query your database using natural language
- Build and refine dashboards through chat
- Collaborate with your team on live data
- Leverage text2sql technology without writing SQL
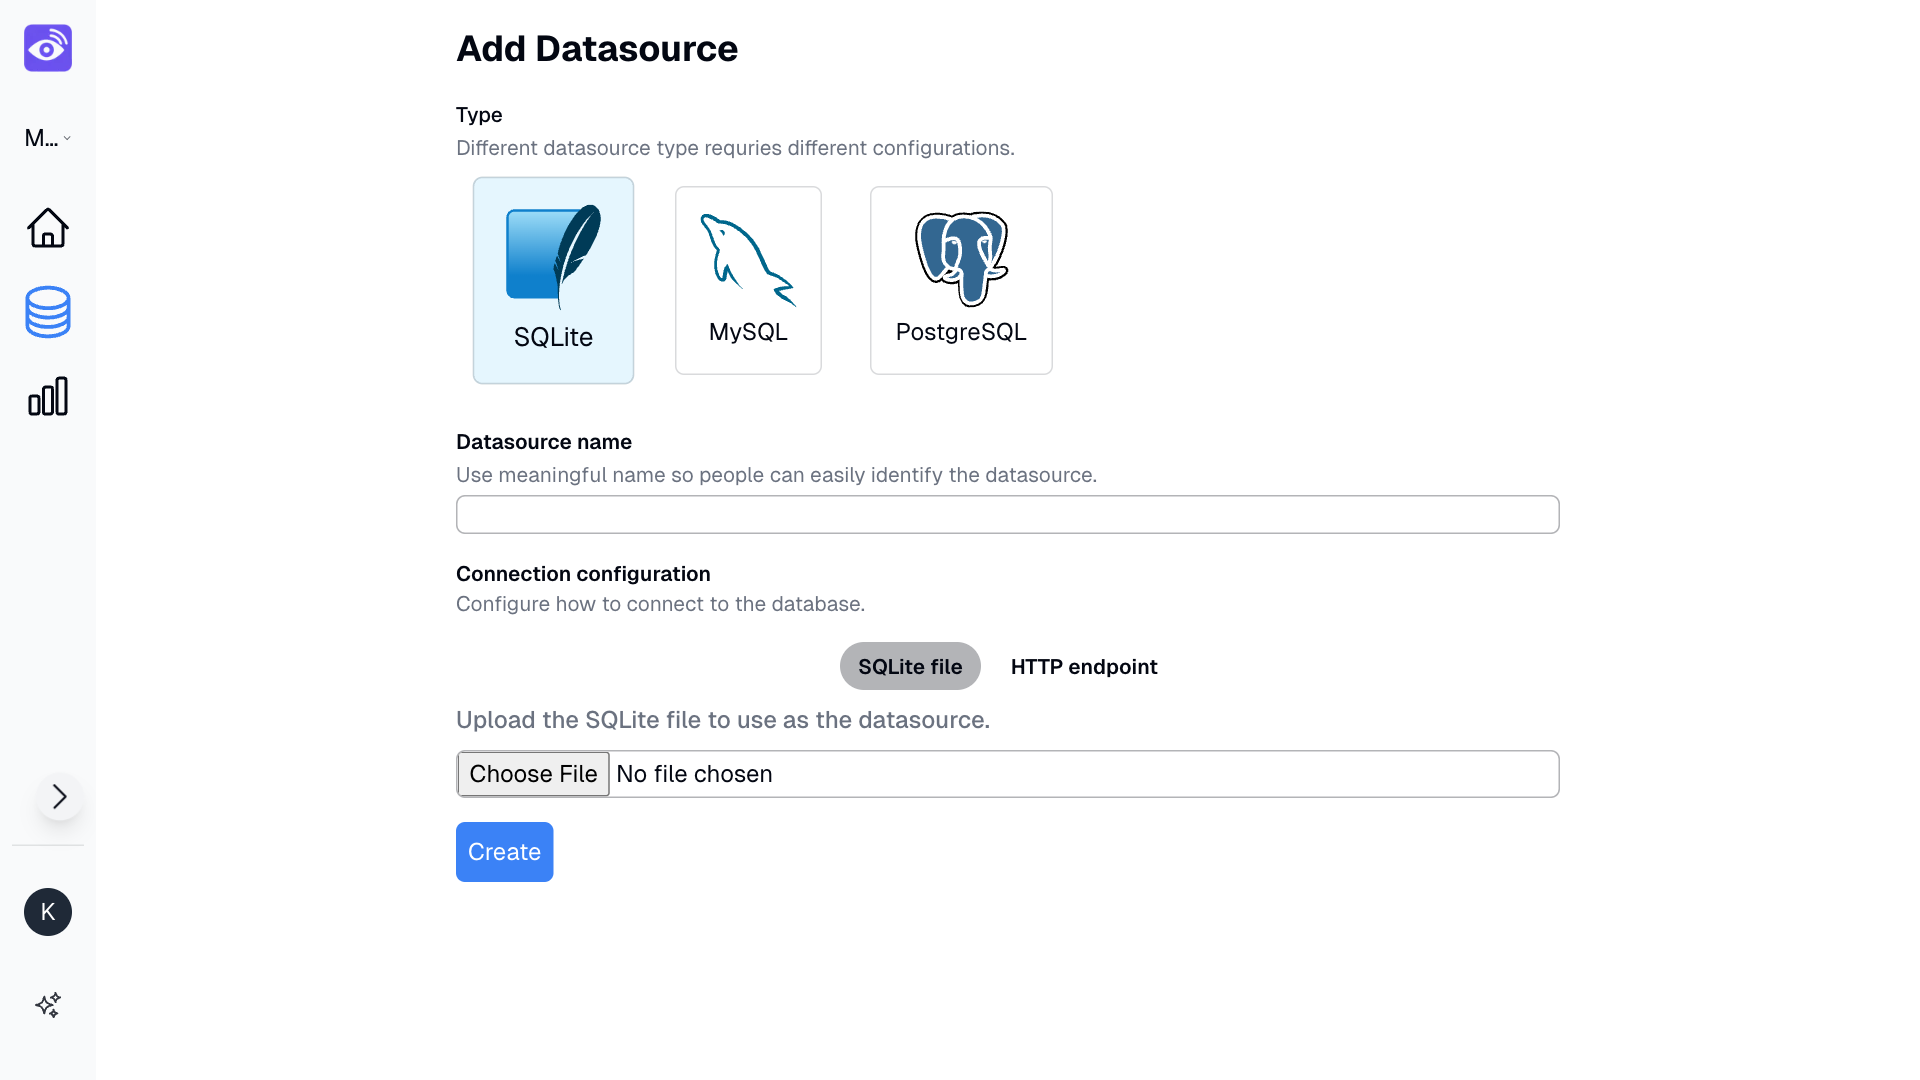
Step 1: Connect Your Data Source
Getting started with Visper's AI analytics platform is simple:
- Go to the Data Source page.
- Click “Add Private Datasource” to securely connect your own database — Visper supports popular engines like SQLite, MySQL, and PostgreSQL.
- Or, start instantly using one of Visper’s Open Data Sources.
For this guide, we’ll connect to a public financial dataset:
“This data source provides 20 years of financial data on leading U.S. stocks, indexes, and ETFs.”
Click Use — and your data source is connected in seconds.
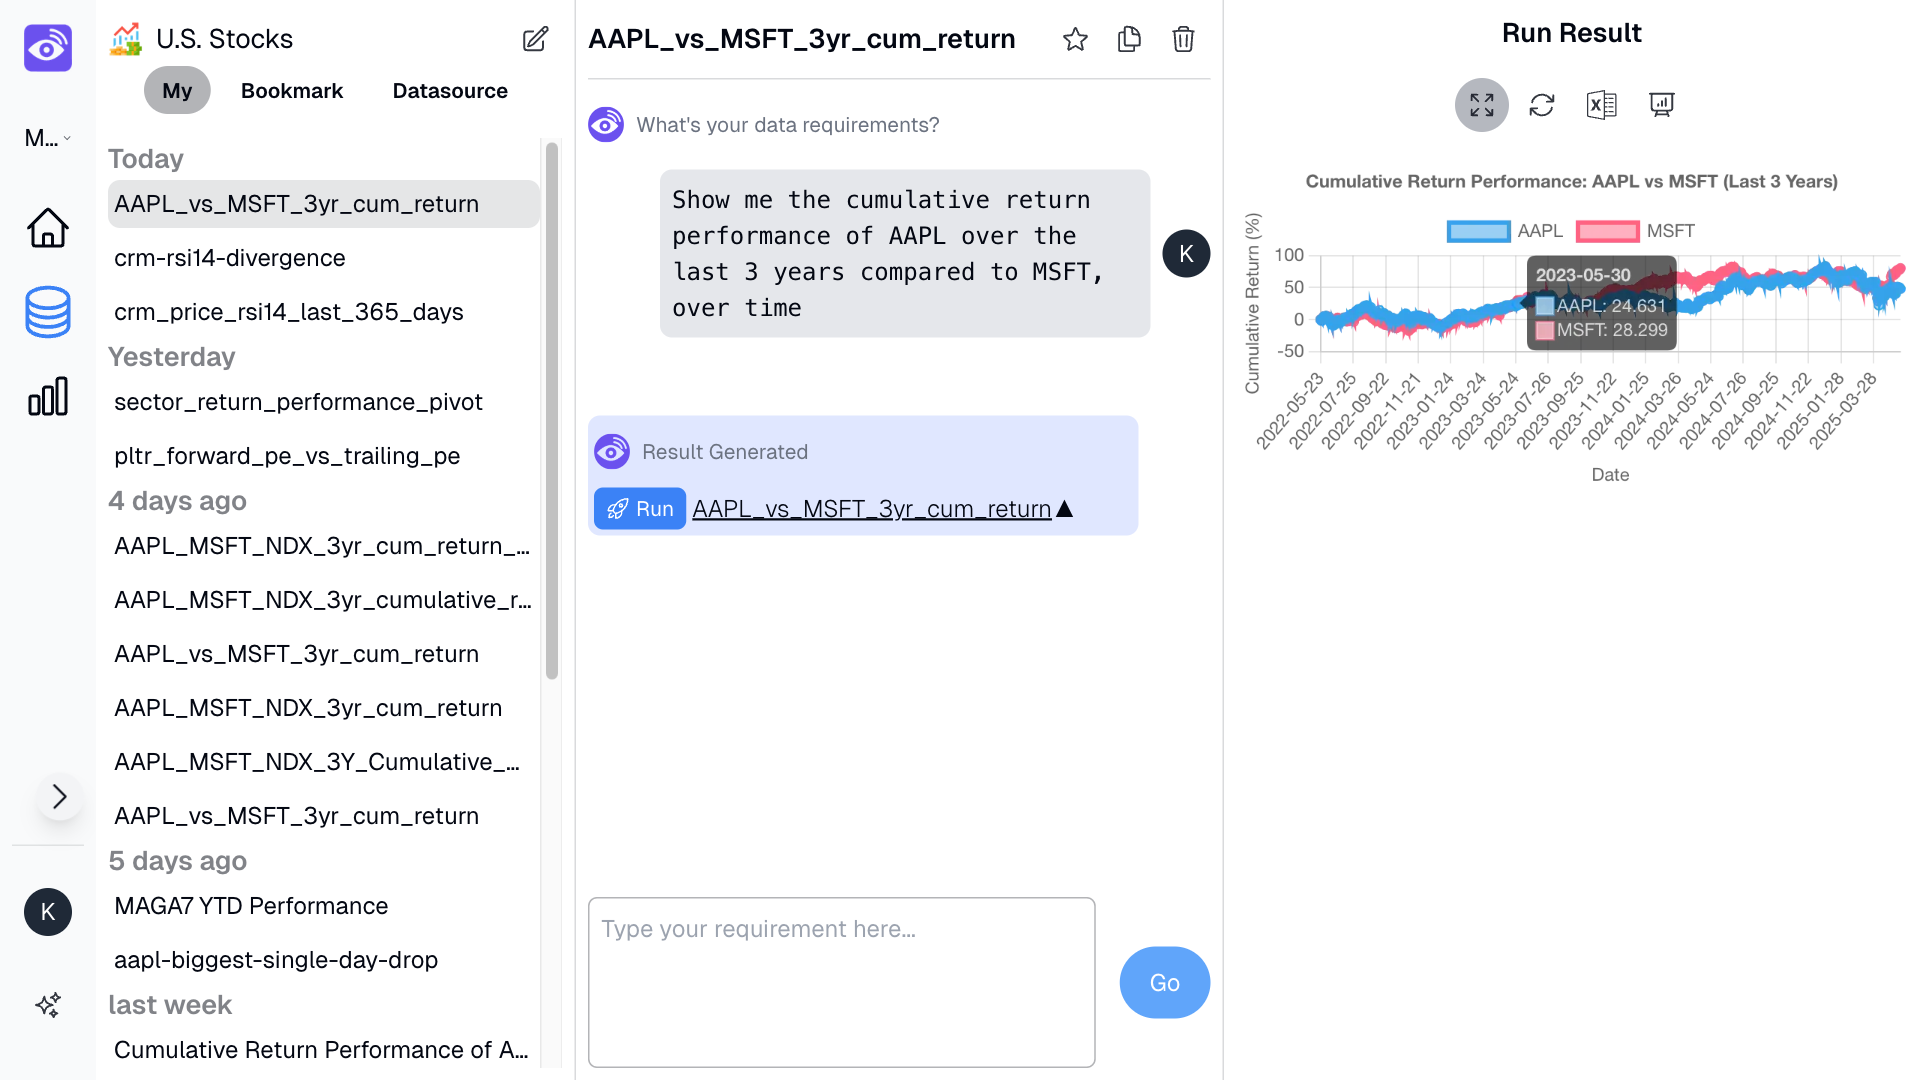
Step 2: Query Your Database Using Natural Language
With your data source connected, it’s time to let the AI data analyst in Visper take over.
In the chat field, type your question in plain English:
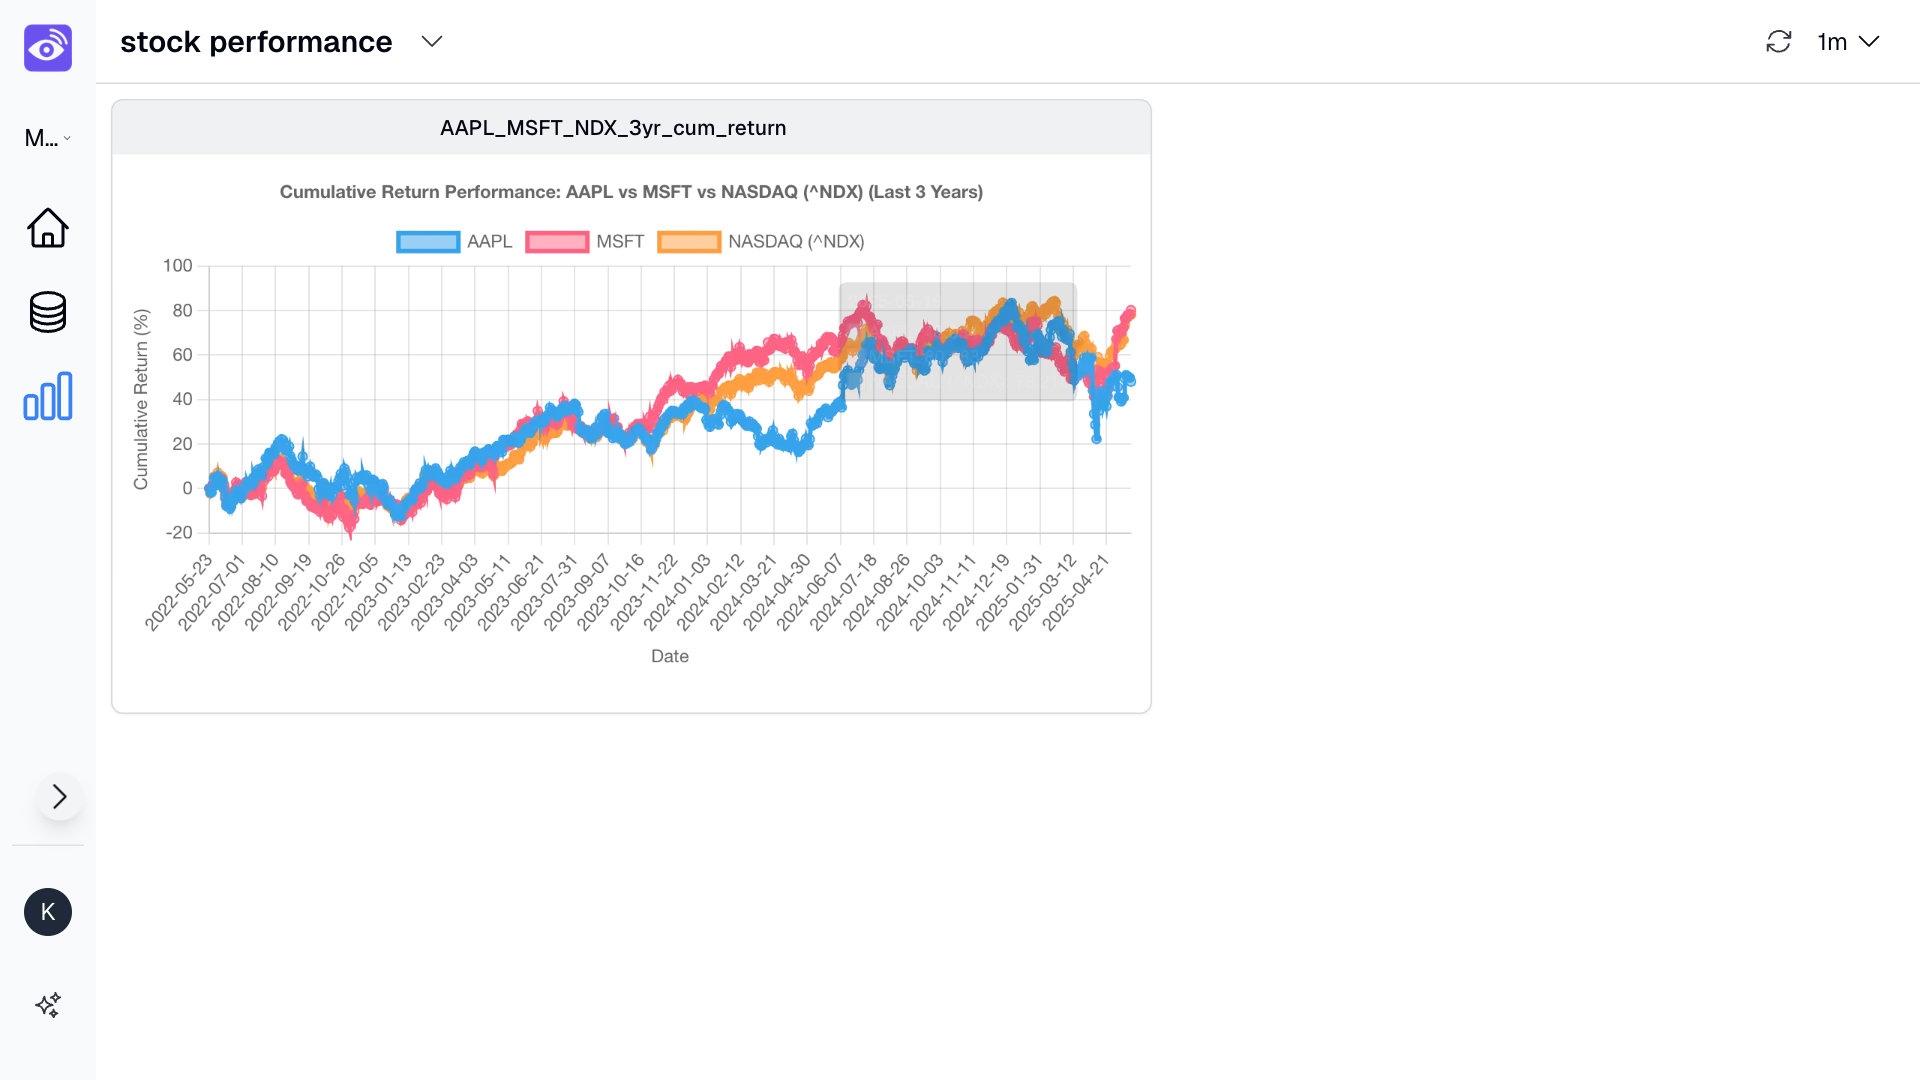
“Show me the cumulative return performance of AAPL over the last 3 years compared to MSFT, over time.”
Click Go. Visper uses text2sql to convert your question into a SQL query, analyze the data, and instantly generate a clean, interactive chart. No SQL knowledge needed — it’s chat-to-query-database, made simple.
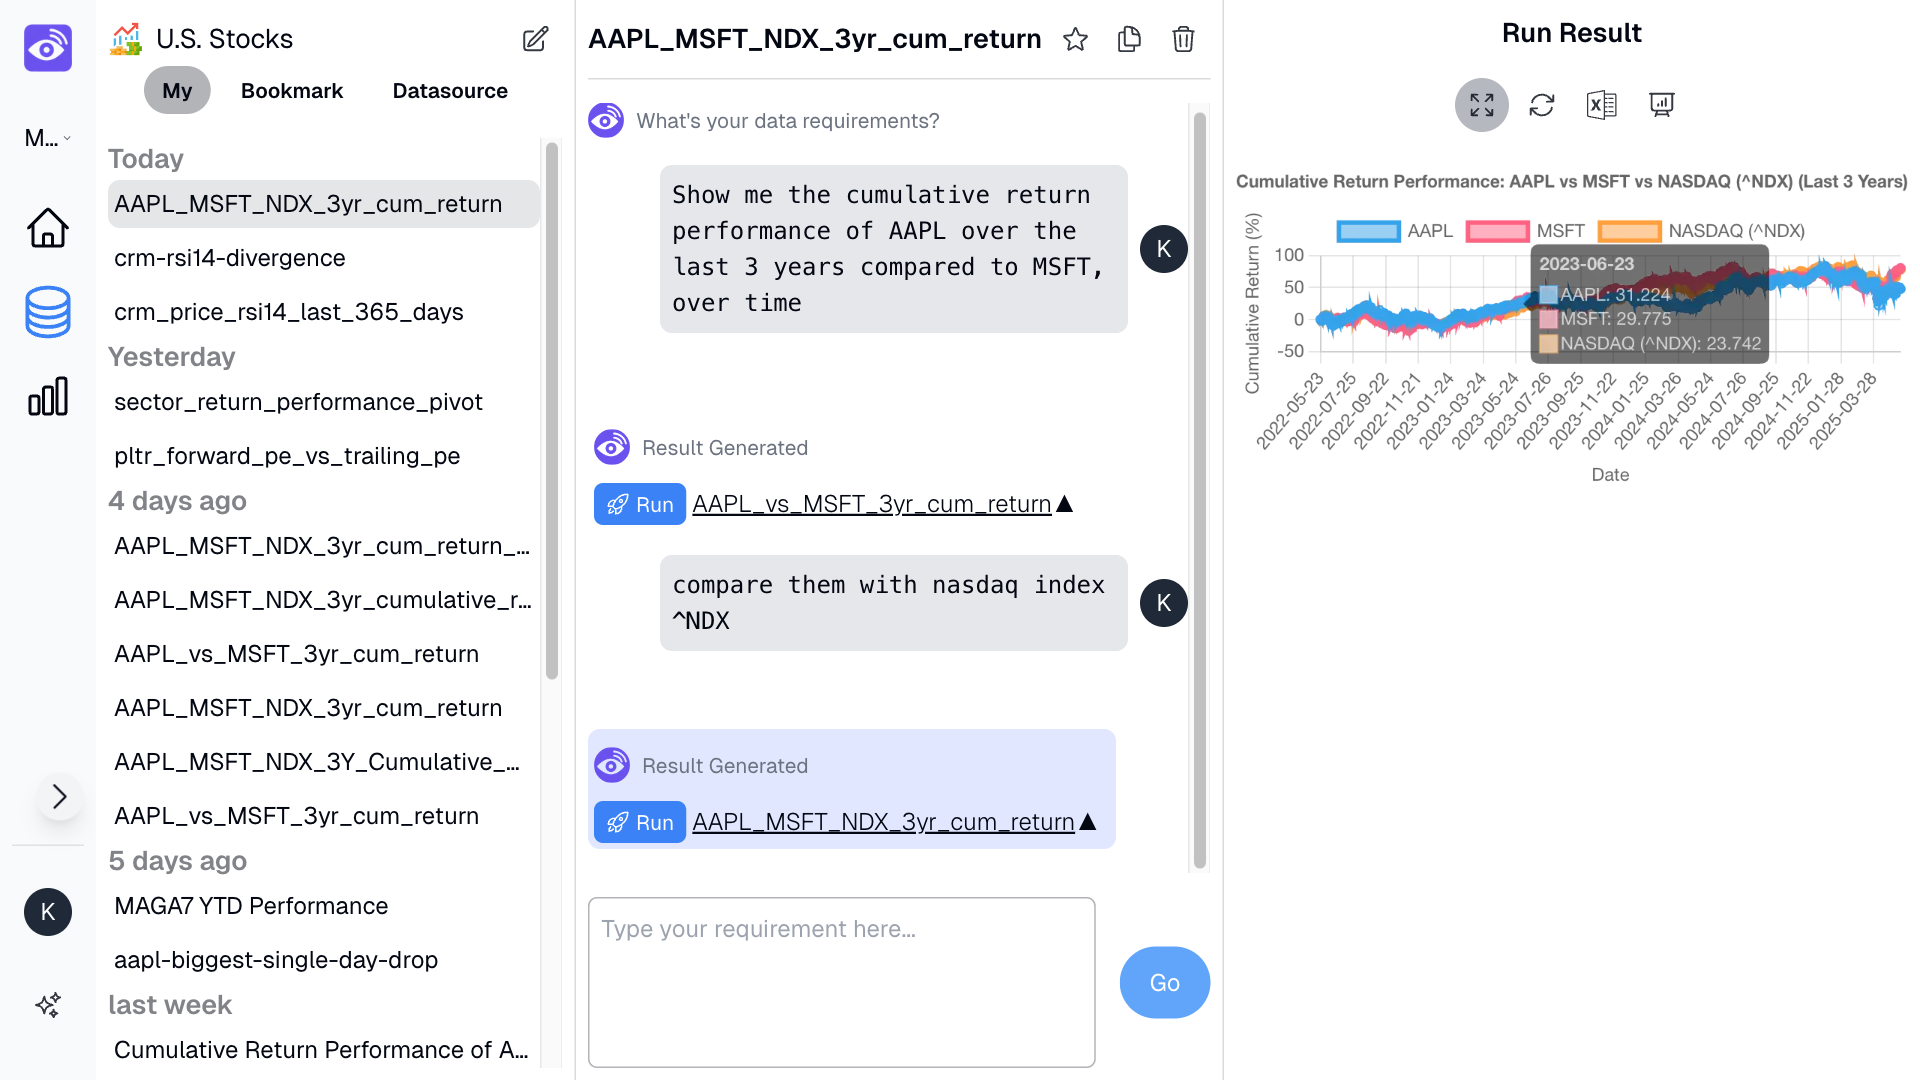
Step 3: Refine Your AI-Generated Chart Through Chat
Want to improve or expand your analysis? Just keep chatting.
Type:
“Compare them with the NASDAQ index ^NDX.”
Click Go. Visper understands the context of your previous query and updates the chart to include the NASDAQ 100 index.
This is true chat-to-build-dashboard functionality — your dashboard evolves naturally as you explore more questions.
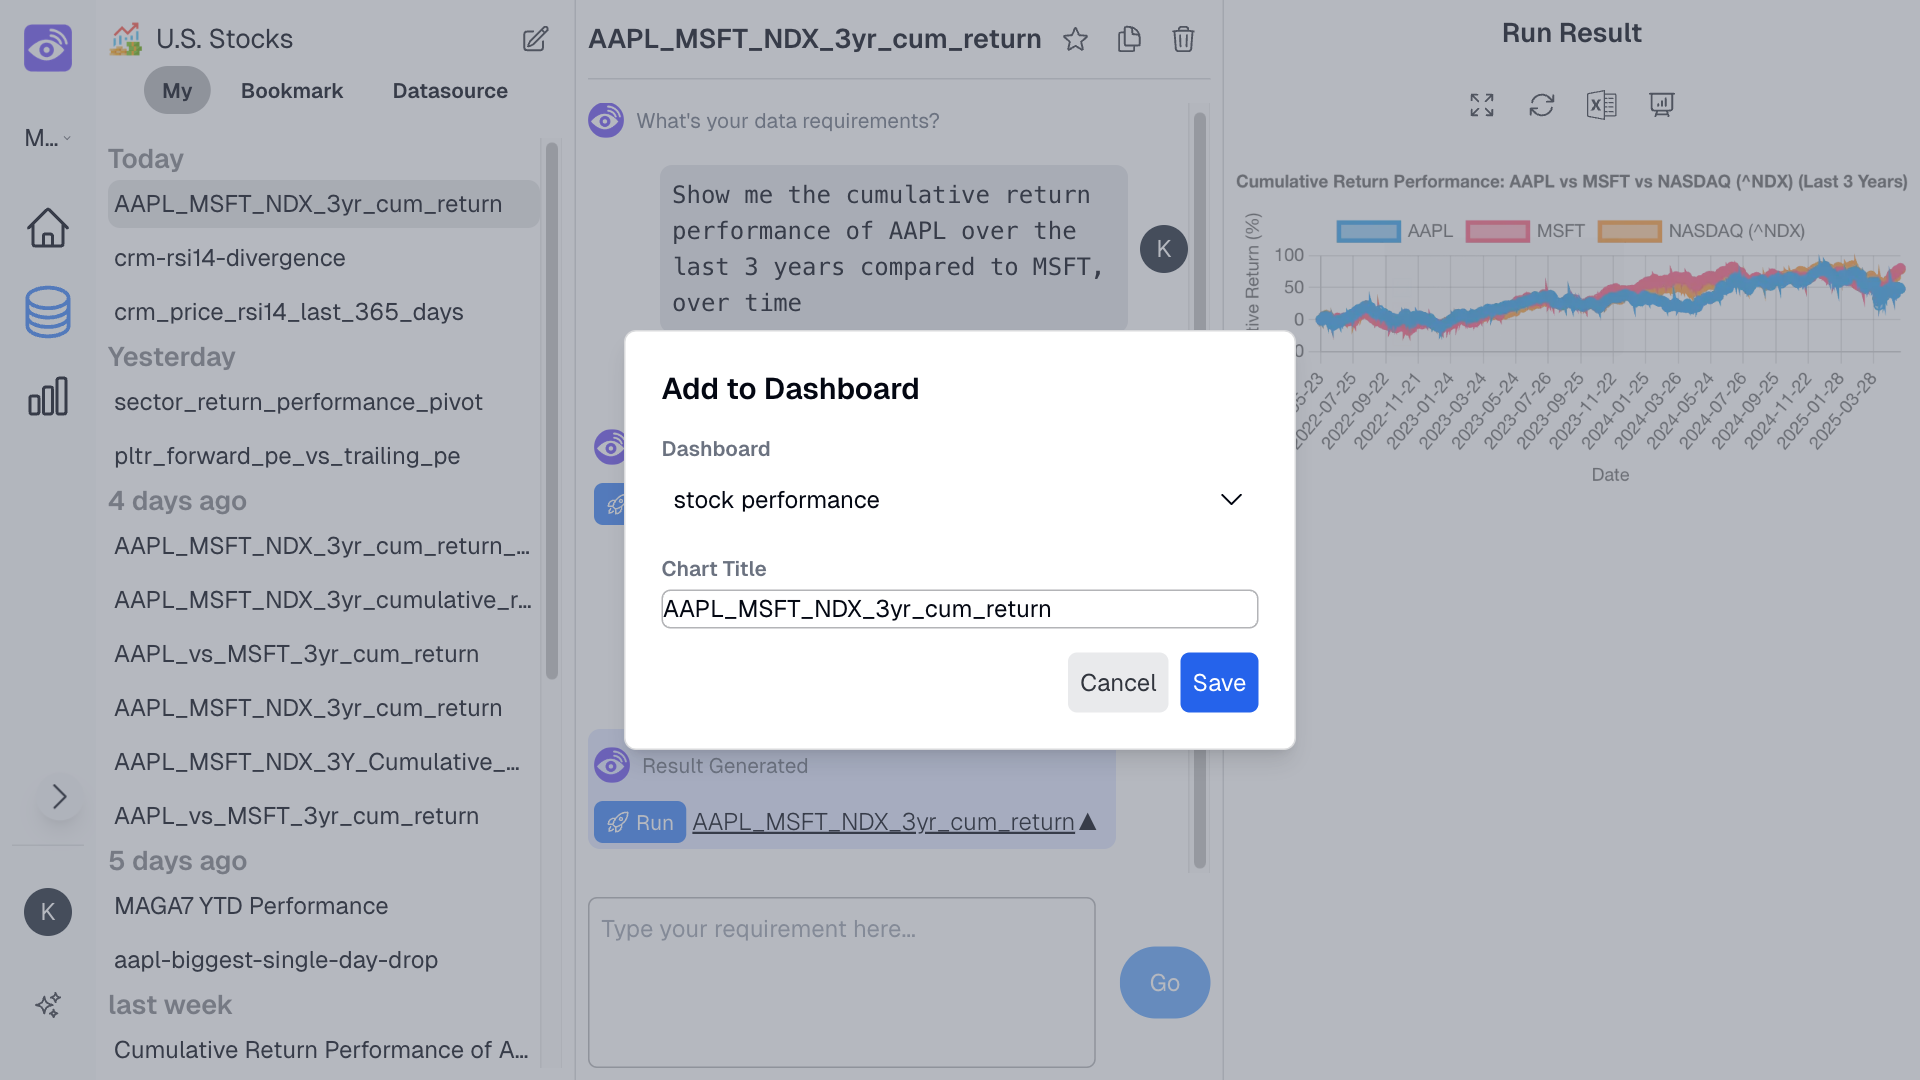
Step 4: Build a Live Dashboard from Your Queries
Once you’ve created a chart with AI, you can pin it to a dashboard:
- Click “Add to Dashboard”.
- Choose your destination (e.g., Stock Performance dashboard).
- Click Save.
Your dashboard is now live, interactive, and auto-refreshing every minute — ideal for real-time data monitoring.
Step 5: Collaborate and Share with Your Team
With Visper, you can:
- Customize your dashboard layout for better clarity.
- Share dashboards with teammates.
- Continue refining and expanding your analysis via chat.
Visper enables AI-powered data collaboration, helping teams make faster, smarter, and data-driven decisions together.
Why Visper? Your AI-Powered Data Analytics Assistant
Visper combines the power of AI, natural language processing, and real-time visualization to redefine how teams interact with data.
✅ Query any database using natural language
✅ Automatically generate SQL using text2sql
✅ Build and refine dashboards with chat
✅ Collaborate on live dashboards
✅ No code, no barriers — just insight
Whether you're a business leader, data scientist, or new to analytics, Visper is your intelligent AI data analyst that makes querying databases and building dashboards as easy as chatting with a colleague.
Ready to Explore Your Data?
Start your journey today with Visper — the modern way to query your database and build dashboards using AI and natural language.